
Building an Interactive 3D Solar System Visualizer with Three.js and Codex
What broke, why it broke, and what fixing it taught me about 3D graphics and AI-assisted coding.
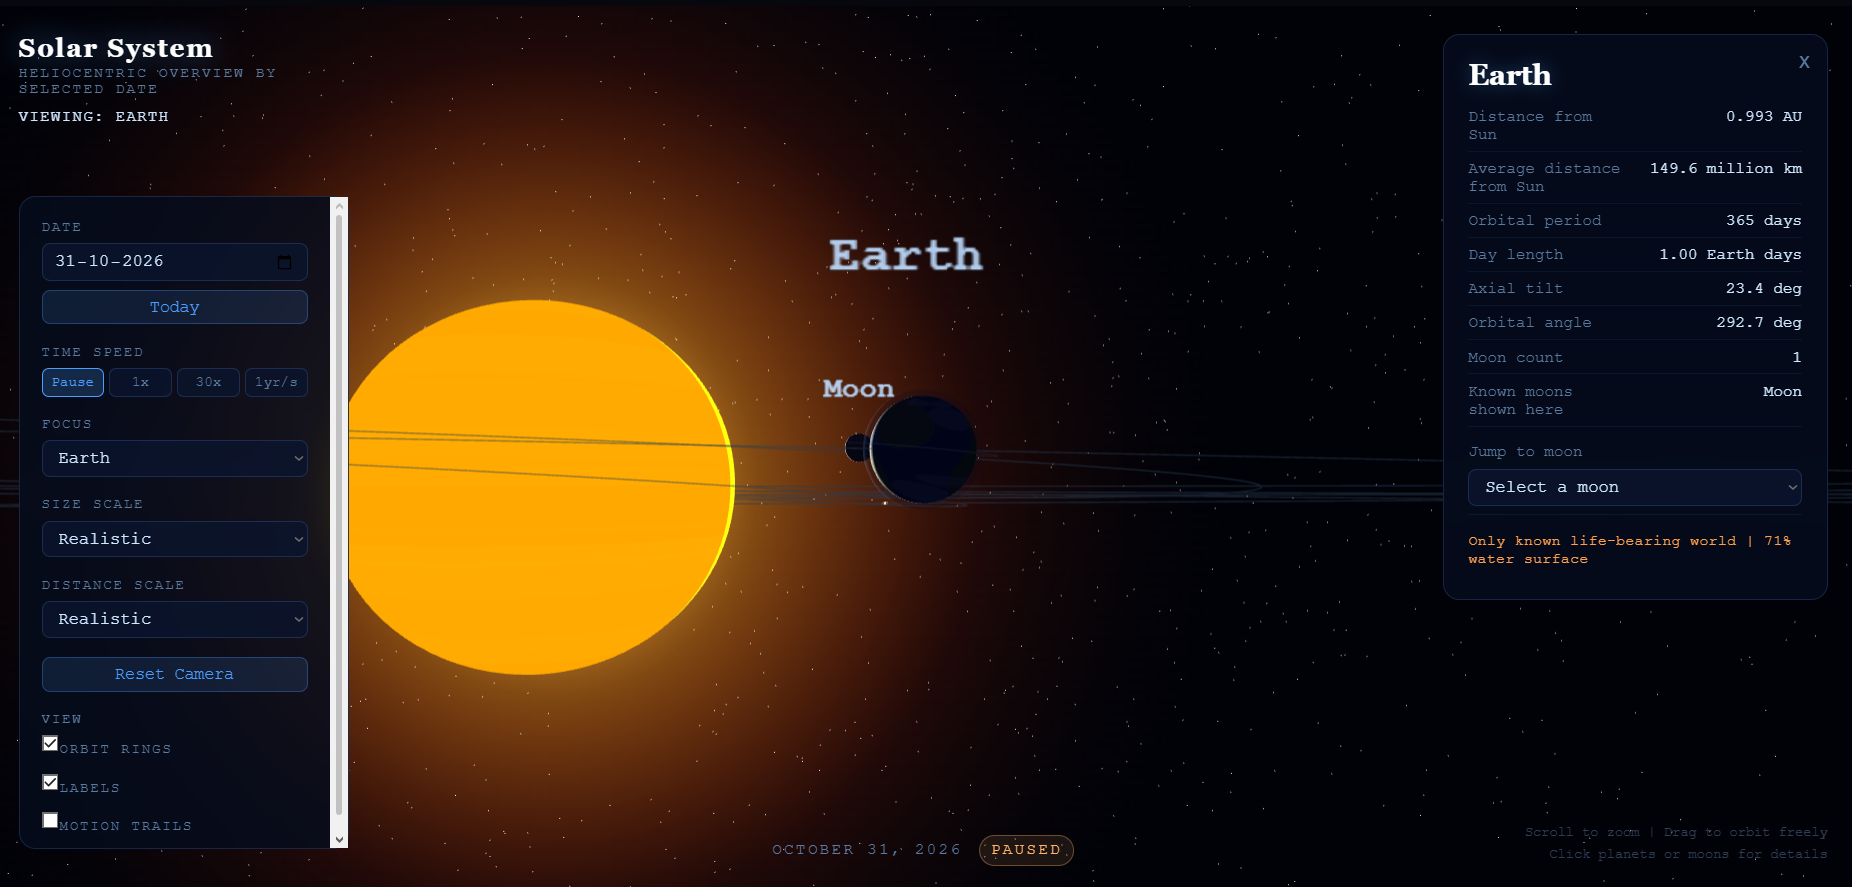
Building a Solar System visualizer sounds fairly straightforward at first: put the Sun in the middle, add the planets, give them orbits, and let the user move the camera around. Once I actually started building one, I found that the difficult part was not getting spheres to appear on the screen. It was making the different parts of the simulation agree with each other.
[Visit the Solar System Visualizer here]
The project is an interactive 3D Solar System visualizer built with Three.js. It includes date-driven planetary positions, interactive planets and moons, camera controls, orbital paths, trails, labels, and two different approaches to visual scale. The project is still a work in progress, and several of the features were added or changed because something that looked reasonable in one part of the implementation caused problems somewhere else.
This post is about some of those problems and what I learned while solving them, particularly around orbital calculations, scale, coordinate systems, animation time, camera behaviour, and using AI assistance while debugging.
This project was also a bit of a throwback for me. Back in 6th grade, I was part of an astronomy club where we got a CD with an application that showed the real-time positions of celestial bodies, a topocentric view looking up from Earth. This project takes the opposite approach, a heliocentric one, looking down at the whole system from outside it. There is a small thread connecting something I used as a kid to something I ended up building years later.
I still check Timeanddate’s Night Sky Tonight page on the clearest nights when something bright catches my eye. Sirius has been my favourite ever since.
1. Why a Solar System Is a Surprisingly Difficult 3D Problem
The first version of the idea was simple enough. Three.js provides the scene, camera, renderer, lighting, meshes, materials, and controls, so creating a basic 3D environment is relatively quick. The planets can be represented as spheres, their orbits as lines, and the user can move around the scene using OrbitControls.
The complication appears when those objects need to represent something about the real Solar System. Planetary distances are enormous compared with planetary radii. The Earth is tiny compared with the distance from Earth to the Sun, and the distance between planets is much larger still. If everything is represented using the same physical scale, the planets become almost impossible to see. If everything is enlarged or compressed for visibility, then the resulting scene is no longer physically proportional.
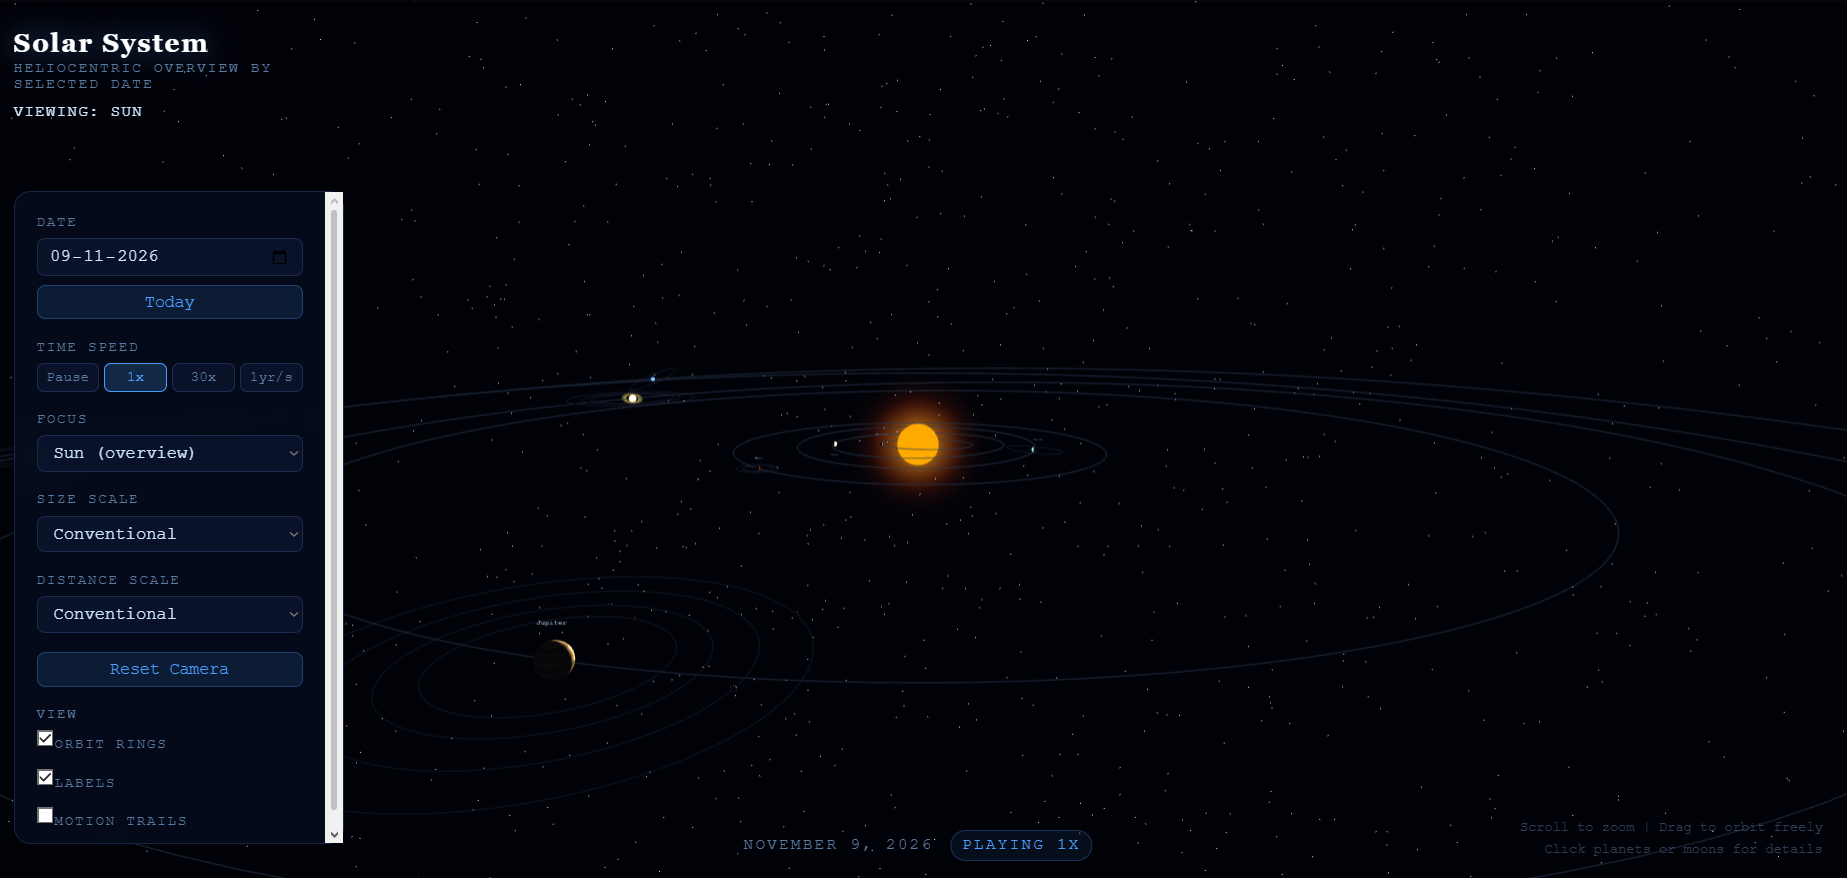
That led me to implement two scale modes. The conventional mode compresses the distances and uses visually enlarged bodies so that the Solar System remains practical to explore. The realistic mode increases the scene scale and calculates displayed body sizes from their actual radii. The distance scaling and body radius scaling are therefore handled separately in the implementation.
There was another complication: the scale modes could not just change a few numbers after the scene had already been created. Planet and moon meshes, orbit lines, and their positions all depend on the selected scale. Changing the mode therefore became a scene rebuild operation rather than just changing a single global variable.
2. Building the 3D Scene with Three.js
The Three.js part of the project starts in scene.js. The scene creates a WebGL renderer, a perspective camera, lighting, a starfield, the Sun, planets, moons, orbital paths, labels, and controls. The initial camera is placed far enough away to see a large portion of the system, while OrbitControls handles rotation, panning, damping, and zooming.
The starfield itself is procedural. Instead of loading thousands of individual stars, the implementation creates 8,000 random points distributed around the scene. This gives the visualizer a background without requiring a large collection of image assets.
The planets are created through a common createPlanet() function. Each planet gets a sphere, material, texture, axial tilt, label, and, where applicable, moons and rings. The planet data is kept separately in planets.js, where properties such as radius, orbital period, distance from the Sun, rotation period, axial tilt, and moon information are stored.
This also made it possible to add features without manually rewriting the creation logic for every planet. For example, Saturn’s rings and the atmospheres around certain planets are handled as additional objects during the planet creation process rather than being baked into the basic sphere.
The Sun is also more than just a sphere. It has a procedural texture and a separate corona sprite with an additive material. The corona is scaled relative to the Sun’s display radius, which lets the effect remain connected to the selected visual scale.
3. From Orbital Data to 3D Coordinates
One of the more technical parts of the project is calculating planetary positions rather than simply moving planets around predefined circular paths.
The astronomy module first converts the JavaScript Date into a Julian Date and then calculates the number of days since J2000. The planetary orbital elements vary with that value. These elements include quantities such as semi-major axis, eccentricity, inclination, longitude of the ascending node, argument of perihelion, and mean anomaly.
The mean anomaly is then used to solve Kepler’s equation. The implementation uses an iterative Newton-Raphson method:
function solveKepler(Mrad, e) {
    let E = Mrad;
    for (let i = 0; i < 30; i++) {
        const f = E - e * Math.sin(E) - Mrad;
        const fp = 1 - e * Math.cos(E);
        const dE = f / fp;
        E -= dE;
        if (Math.abs(dE) < 1e-10) break;
    }
    return E;
}
Once the eccentric anomaly is available, the code calculates the position in the orbital plane and then rotates that position using the orbital orientation parameters. This produces heliocentric Cartesian coordinates.
The important thing for the visualizer is that the result is a position that changes with the selected date. The interface is therefore not simply replaying a fixed animation: changing the date changes the calculated planetary positions.
4. The Moon Problem: When Realistic Scale Broke the Visualization
The first major scale-related problem appeared when I started working with moons.
A planet’s radius and the distance to its moon are vastly different quantities. If the planet is enlarged enough to be visible while the moon’s orbital distance is kept at a physically proportional scale, the moon can end up visually intersecting the planet. This happened during development in the realistic scale version.
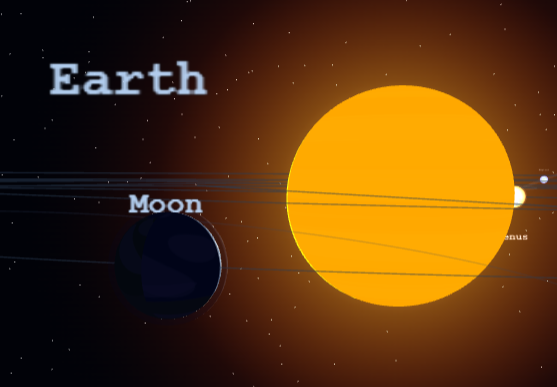
[Image: Earth's moon inside Earth]
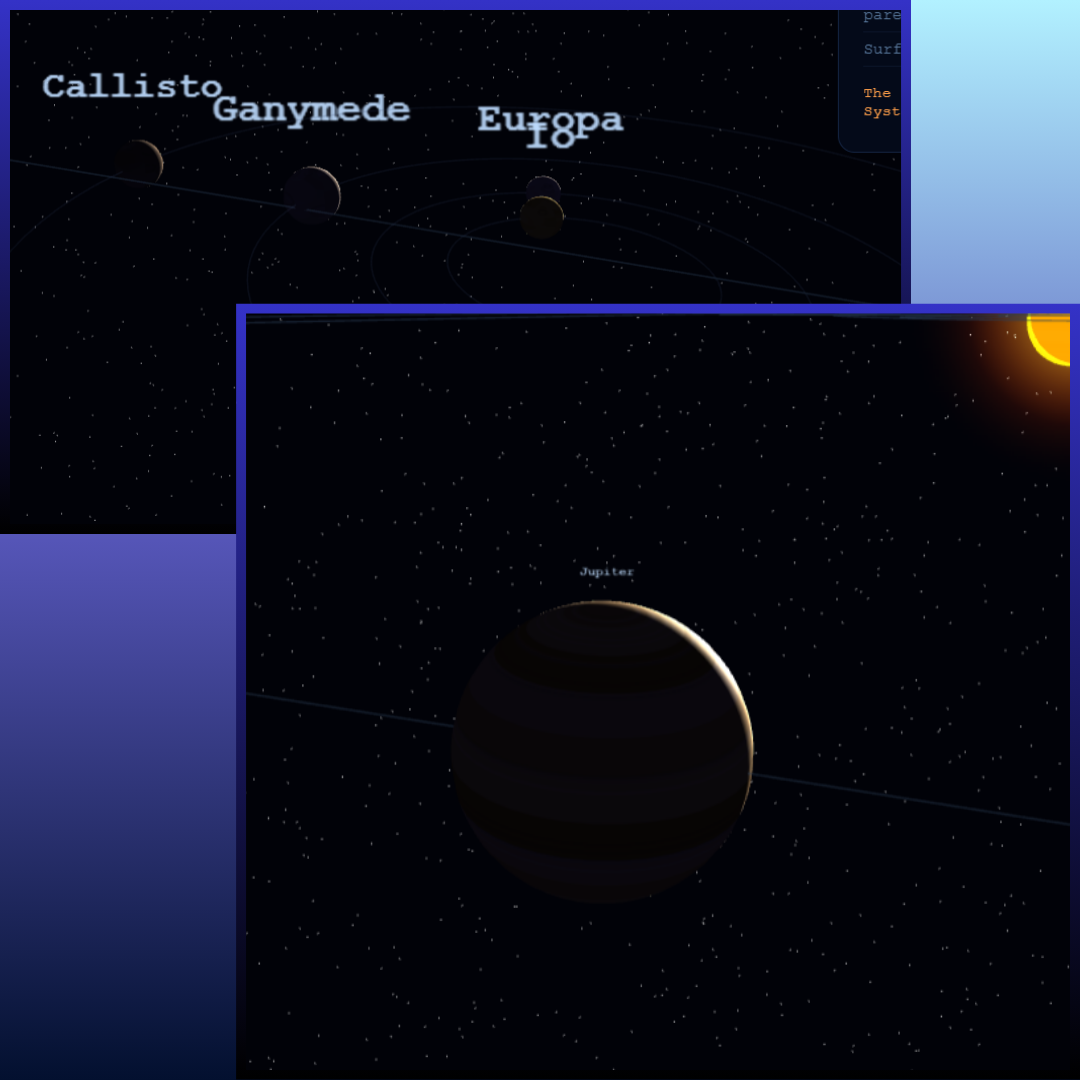
[Image: The 4 main moons inside their parent planet Jupiter]
The problem was not that the Moon’s orbital distance was randomly chosen. The implementation actually stores the Moon’s semi-major axis as 384,400 km and its radius as 1,737.4 km. The realistic moon orbit calculation converts that semi-major axis into the scene’s units, while the realistic moon radius is calculated independently from its actual radius relative to Earth’s radius.
The difficulty was that the visualization had two competing requirements: preserve meaningful astronomical proportions while still producing objects large enough to see. Changing one scale factor could therefore make one relationship better while making another relationship worse.
The solution was to treat body size and orbital distance as separate scaling decisions. That does not make the scene a physically exact simulation, but it makes the relationship between the two quantities explicit in the code.
The Moon also needed different treatment from the other moons. Its position is calculated from date-dependent orbital elements and added to Earth’s heliocentric position, rather than simply being placed at a fixed circular position around Earth.
5. Translating Astronomical Coordinates into the Three.js World
Calculating an astronomical position is only half of the problem. The resulting coordinates still have to be converted into the coordinate system and scale used by the Three.js scene.
The astronomy module produces heliocentric coordinates, while the scene has its own axis arrangement and scale. planets.js contains the toScenePosition() function, which applies the selected distance scale and rearranges the axes for the Three.js world. In realistic mode, the coordinates are multiplied by the realistic AU-to-units scale; conventional mode uses a compressed distance function so that the outer planets do not make the inner Solar System impossible to explore.
This distinction became particularly important while debugging the Moon. The Moon’s position could be mathematically reasonable before the scene transformation and still appear in the wrong place after scaling and axis conversion.
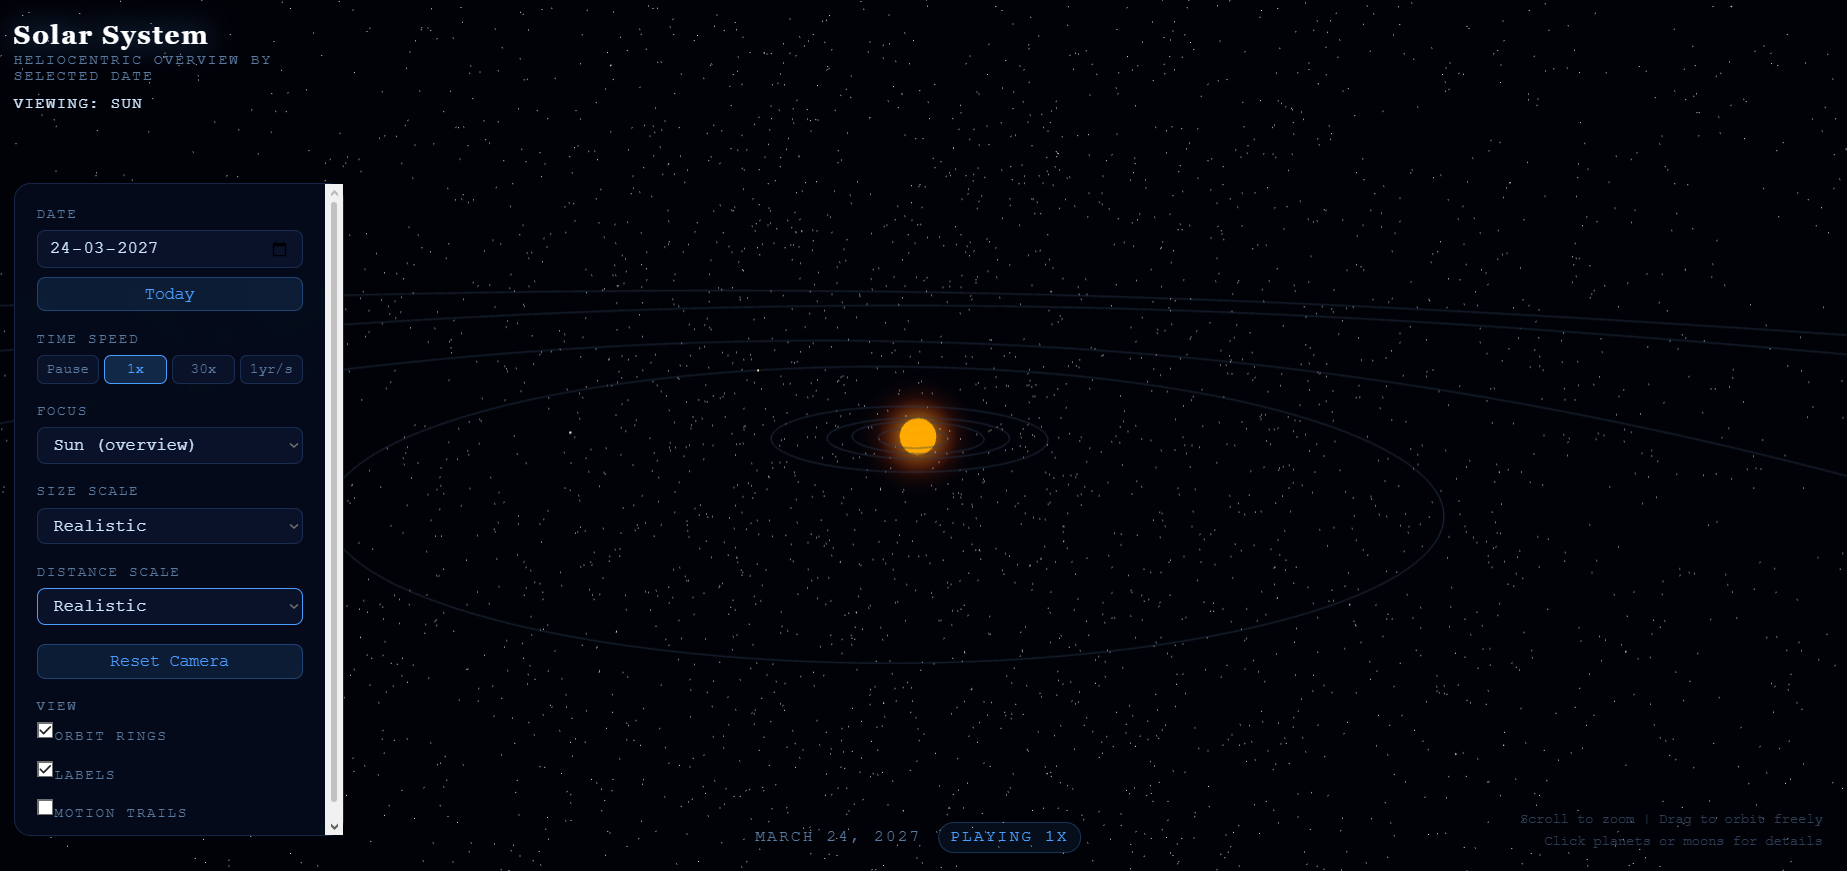
[Realistic scale]
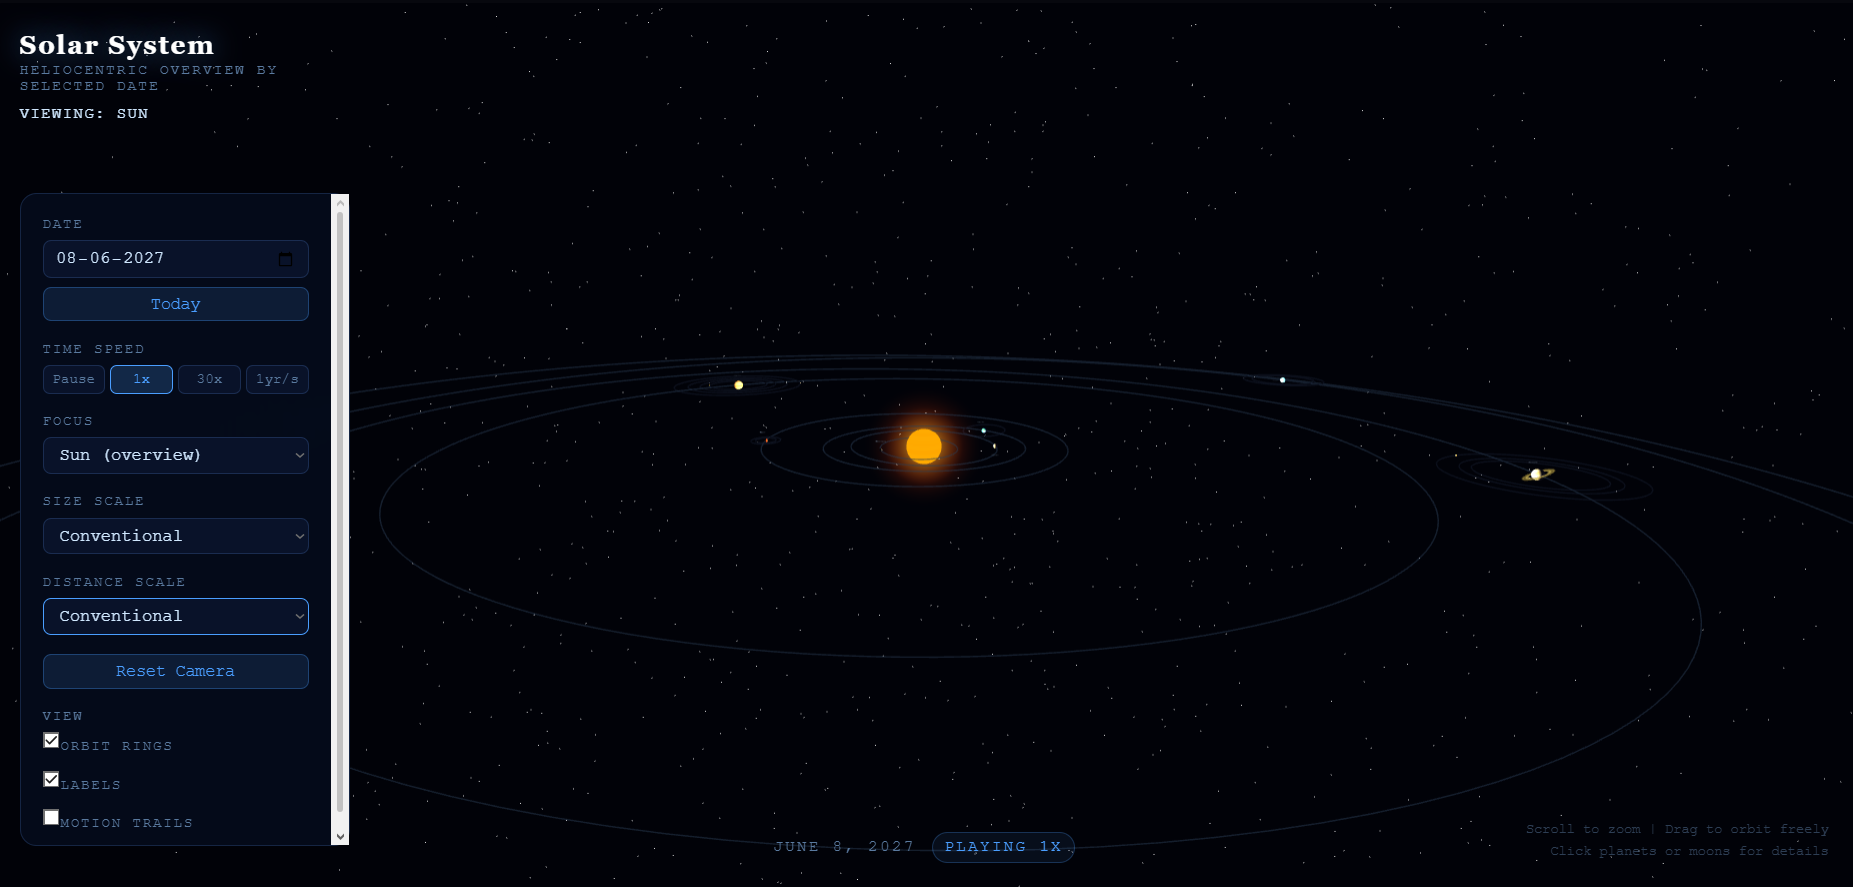
[Conventional Scale]
The project therefore has a clear boundary between calculating where a body is astronomically and deciding where that body should appear in the visual scene. That separation was useful when debugging because it narrowed down whether a problem came from the orbital calculation or from the visualization layer.
6. Making Time Part of the Simulation
Once the planets have date-dependent positions, the next step is making the date move automatically.
The main animation loop measures the elapsed real-world time between frames and converts that duration into simulated days according to the selected time speed. The actual implementation is:
const dtDays = (dtMs / 1000) * timeSpeed;
currentDate = new Date( currentDate.getTime() + dtDays * 86400000 );
The updated date is then passed into the planetary position update, so increasing the simulation speed effectively makes the astronomy calculations advance faster as well.
This approach also means the animation is not tied to a fixed number of frames. The amount of simulated time that passes depends on elapsed time, which is important because the browser does not necessarily render every frame at exactly the same interval.
The date can also be changed directly through the UI. Selecting a new date pauses the simulation and recalculates the planetary positions for that date, while the Today button restores the current date.
7. The Camera Bugs: Zooming Too Far and the Sun Eating the Solar System
The camera produced some of the most visually obvious bugs.
At one stage, it was possible to zoom extremely close to celestial objects. This sounds like a small controls issue, but in a scene containing bodies with very different sizes, unrestricted zoom can quickly become unusable. A camera distance that makes sense around Jupiter can be completely wrong when the user focuses on a moon.
The scene therefore calculates a focus distance based on the selected object’s type and radius. Planets, moons, and the Sun have different distance ranges, and the camera’s minimum distance is also adjusted based on the bodies currently present in the scene.
The other camera problem was much more dramatic: the Sun could effectively swallow the frame. When its display size and the camera constraints interacted badly, the user could end up with the Sun dominating the viewport while much of the rest of the Solar System disappeared from view.
The camera now uses a larger focus distance for the Sun and different distance ranges for planets and moons. The following system also smooths the camera target instead of instantly snapping it to a moving object.
This was one of those cases where a feature that seemed independent- camera controls- was actually affected by the scale and object size decisions elsewhere in the project.
8. Why the Code Ended Up Being Split into Modules
The project was not split into modules because I had the entire architecture planned beforehand. The separation became more useful as the project grew and different kinds of changes started affecting each other.
For example, when the realistic and conventional scale modes were being developed, changing scale affected planet creation, moon creation, orbital paths, and camera constraints. Keeping all of that in one large file would have made it harder to identify whether a problem came from the astronomical calculations, the stored planet data, the scene objects, or the UI.
The current structure reflects those different responsibilities. astronomy.js handles date conversion, orbital elements, Kepler’s equation, and celestial positions. planets.js contains the Solar System data and visual scaling functions. scene.js handles the Three.js scene, objects, camera, controls, labels, trails, and rendering. ui.js handles the interface and information panels, while main.js connects the simulation state to the animation loop.
The practical benefit became noticeable when debugging. If a planet was in the wrong astronomical position, astronomy.js was the first place to inspect. If its distance looked wrong only in a particular scale mode, planets.js became the more relevant place. If the object was correctly positioned but the camera behaved strangely, the problem was more likely in scene.js.
9. Procedural Textures Instead of a Collection of Image Assets
Another part of the visualizer that I wanted to keep relatively lightweight was the planet texturing.
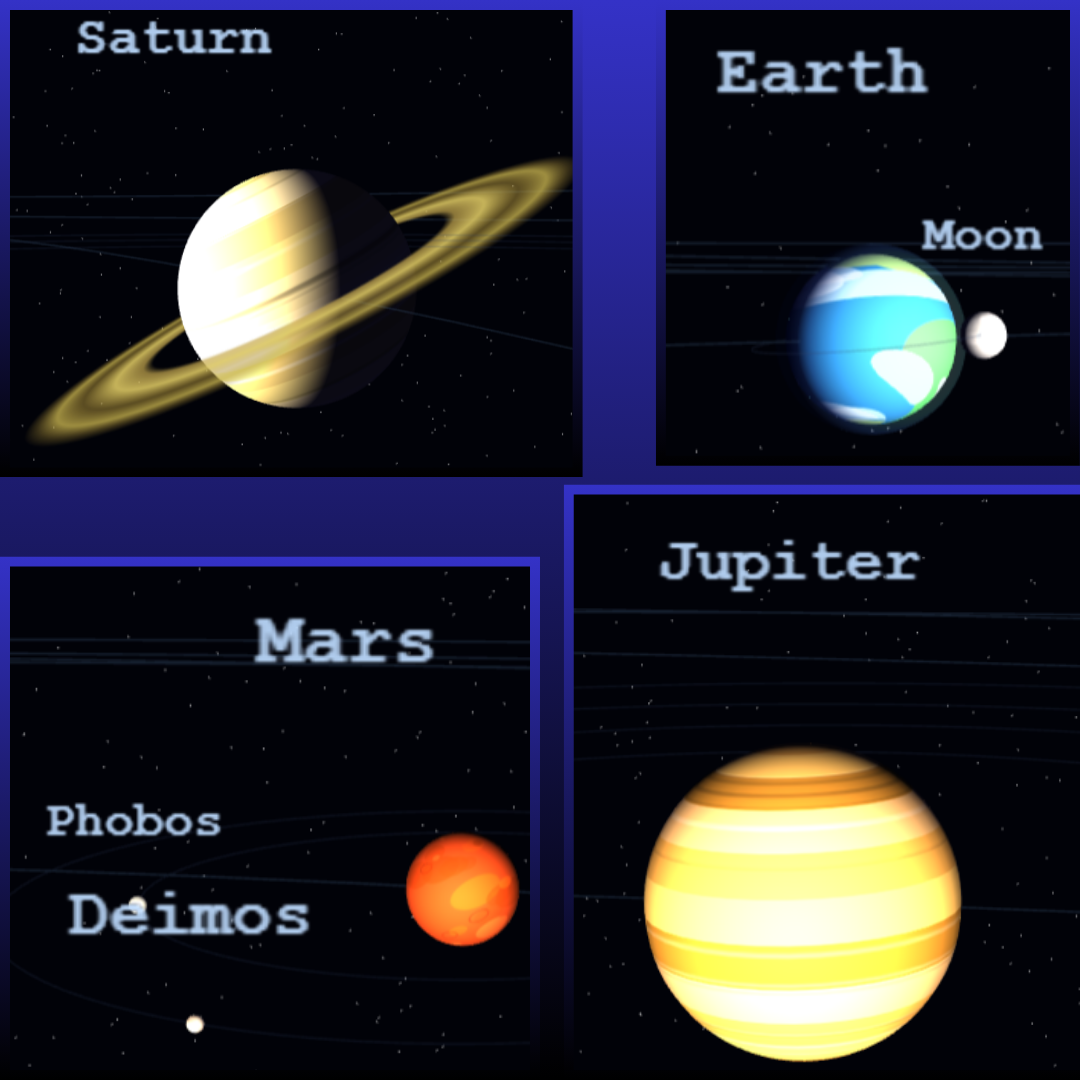
Instead of collecting separate image textures for every planet and moon, the project generates several textures procedurally using HTML canvas. The texture generator supports different styles such as banded, Earth-like, cloudy, and rocky surfaces. The generated canvas is then converted into a THREE.CanvasTexture.
This is particularly useful for a project like this because many of the bodies do not need highly detailed photographic textures to communicate what they are. A procedural texture can give a planet visual variation while keeping the project self-contained.
The same idea is used for some of the other visual effects. The Sun’s texture and corona are generated rather than relying entirely on downloaded assets, and Saturn’s ring appearance is produced with a canvas-based gradient texture.
10. What I Learned from Debugging with AI Assistance
I used AI assistance, including Codex, during development, particularly when working through implementation details and debugging. The useful part was not simply asking for code and inserting the result. The more useful workflow was giving the AI a concrete problem, looking at the suggested change, and then testing whether it actually solved the problem in the running visualizer.
The scale bugs were a good example. A change could look completely reasonable in isolation but behave differently once combined with the planet radius, moon orbit, camera distance, and scene scale. Looking at the actual result in the browser was therefore still necessary.
AI assistance was also useful for navigating a growing codebase. When a behaviour involved several files, it helped identify where the relevant calculation or state change was happening. That made it easier to investigate a problem without manually searching through every part of the project.
At the same time, this project made the limits of that workflow fairly obvious. A generated code change can be syntactically correct and still be wrong for the visual behaviour I want. The final check has to happen against the actual application.
11. Where the Project Goes from Here
The current visualizer sits somewhere between an educational visualization and a rigorous astronomical simulation. It already uses date-dependent orbital calculations, but there is still a lot of room between that and a high-precision ephemeris system.
One possible direction is improving the astronomical model itself: more precise planetary positions, more detailed moon calculations, and potentially better treatment of orbital reference frames. Another is improving the educational side of the visualizer by making the relationship between the numbers and the visualization easier to understand.
There is also plenty of room to improve the interaction model. The current version has selectable planets and moons, information panels, labels, orbital paths, trails, simulation speed, date selection, and multiple scale modes. Future work could build on these features rather than simply adding more objects.
For me, the interesting part is that these two directions are not necessarily the same thing. A more scientifically rigorous simulation and a more understandable educational visualization can require different compromises, so deciding what the project is trying to communicate will become increasingly important as it grows.
12. Conclusion
The Solar System Visualizer started as a 3D graphics project, but a large part of the work ended up being about reconciling different systems: astronomical calculations, visual scale, coordinate transformations, animation time, and camera behaviour.
Some of the most useful debugging moments were also the most ridiculous ones. The Moon ended up inside the Earth. The camera could zoom far too close to objects. And at one point, the Sun could effectively take over the entire scene.
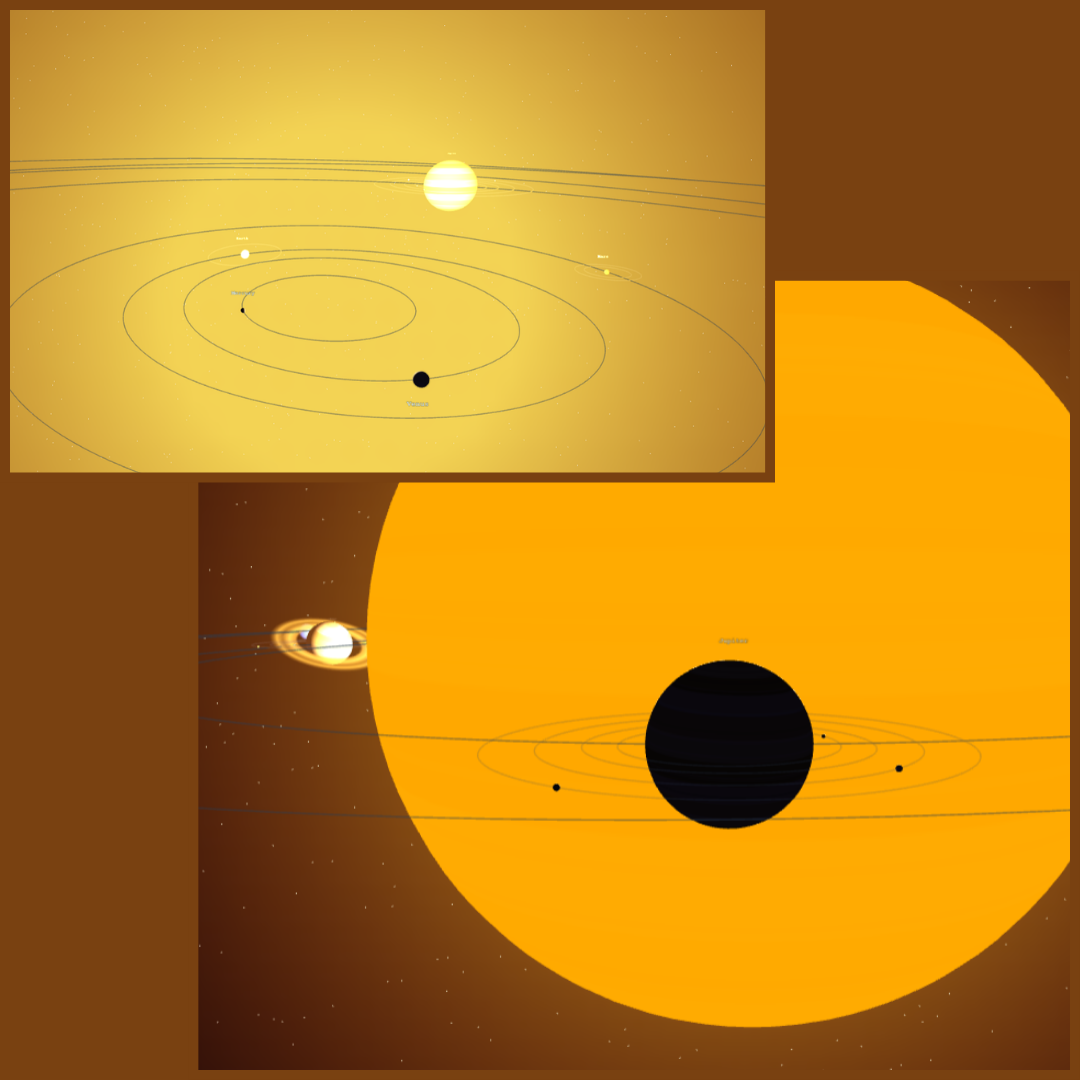
Those bugs were not just cosmetic problems. Each one exposed a different relationship between the underlying calculations and what the user actually sees. Working through them gradually shaped the current implementation and also made the project much more interesting to build.
It is still a work in progress, but that is part of what makes documenting it useful. The finished version may eventually look much cleaner than the version shown in these screenshots. The bugs are evidence of the development process that produced it.
[GitHub]
[LinkedIn]
